I know that I have said this many times, but one of my favorite things to do is combine my hobbies and interests into a new project. For example, in the past I have created a raspberry pi-based pool thermometer. I won’t list them all here – you can search on them if you’d like. For the last year+ I have been focusing on AI / Machine Learning / Copilot, so it seemed like a good time to start a new project. While floating in the pool at the beginning of the summer, it struck me: I needed to create a site where I could automatically pull in (almost) real-time analytics for that night’s game. Its kind of funny when life hits you like that. Sometimes you just know.
So here is what I wanted to accomplish
- Each day, the script would look to see if there was a Sabres game that day. If there was, create a new game entry on a website and include a blurb about the matchup from the NHL’s api.
- After each period, show the following
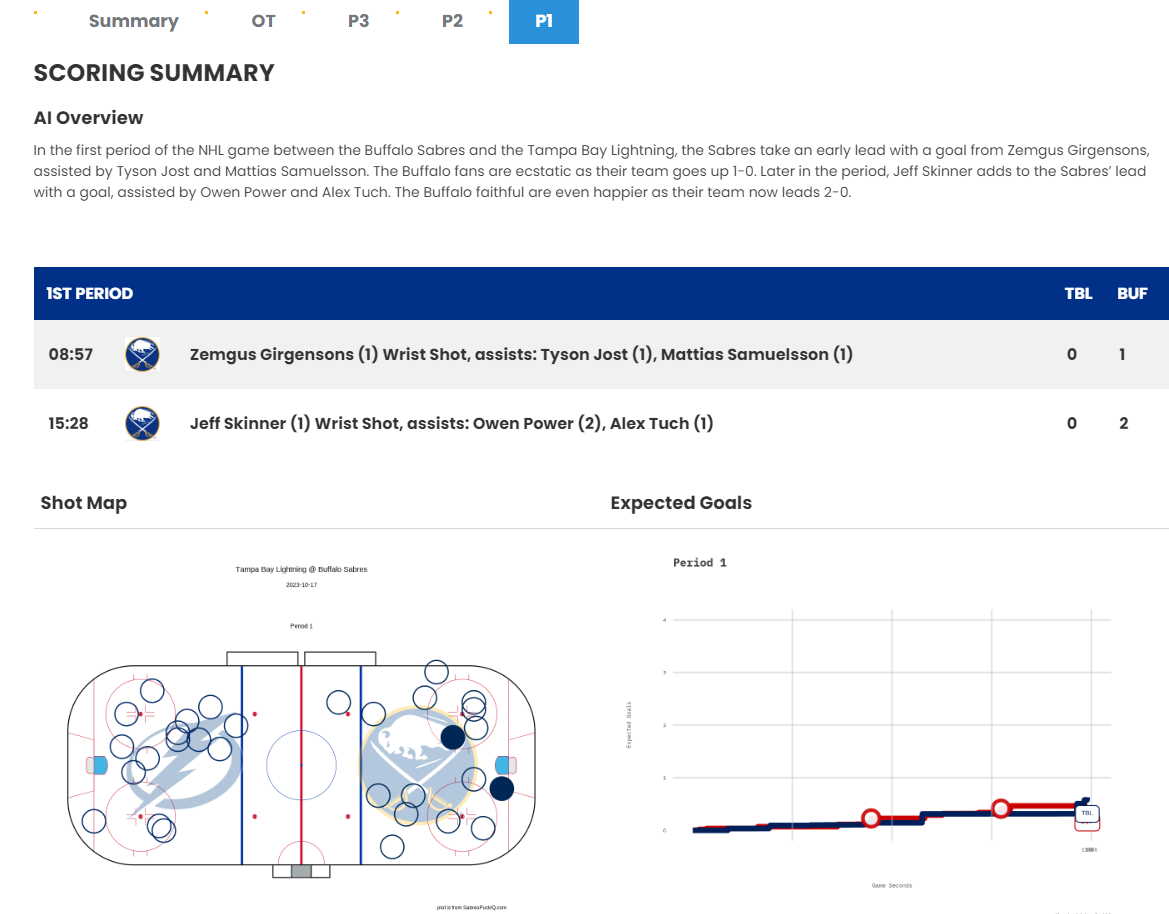
- Scoring summary
- Some fancy stats and graphs: shot map, expected goals, etc. I would be generating these values and graphics in the code using the NHL’s game data.
- A summary of that period provided by AI
- At the end of the game, pull in all of the player stats and show the same metrics for the entire game
- Each time the game page was updated, a similar update would be sent to a twitter account for this site (sorry, I just can’t bring myself to call it “X”)
Here is the setup:
- The site would be hosted in my A2 Hosting account
- I would have all of the logic running in containers on my home server (HAL). Most of the code would be in python as that as where the packages where, but I would need some R.
- API handlers would need to be created to interact with both the site (wordpress / php) and the NHL API.
- A handler set up to call a Large Language Model (LLM) to give me a text summary of each period / game summary. The summary would be based on the stats for that period that I would feed the LLM.
In short, I wanted to be sitting in my seat at the game and bring up my site or twitter account to get the good stuff. Is this data and graphics available anywhere else? I am sure it is, but what fun is that?
The Good News!
I got it working! The results can be seen (for now) at https://sabrespuckiq.com/
The Bad News
As noted earlier, I started coding this in the summer of 2023 (yes, geeks code in the summer). One of the cornerstones of this project was the ability to get free data from the NHL’s stats api. So I spent tens of hours coding this, and it was all coming together. I had created some game logs using data from the 2022-2023 season, and that went swimmingly.
So opening night roles around and I am sitting at the game with my eldest son. The end of the first period rolls around and I am giddy with excitement as I am going to be slapped across the face with some fancy stats. The first intermission ends and… nothing. Same thing with the second intermission. When the game ends, I went home to debug the issue. It was then that the issue hit me: the NHL did not expose the game stats until much, much later. Doh! I know that the journey is the important part of these kinds of projects, but this one hurt a bit. I didn’t care about that stuff the next day, I wanted it that night. So what choice did I have? I could have spent hundreds a year on a real-time game stats service, or I could put the project on the shelf for a while.
For now, it is on the shelf. The journey will have to do, this time.